Dashboards
Network Connectivity
The Network connectivity dashboard shows a graphical representation of the network and tunnels configuration.

When the tunnel is configured but not connected, the diagram shows a dashed line. You can zoom-in/out by moving the mouse up/down while holding the right-click mouse button.
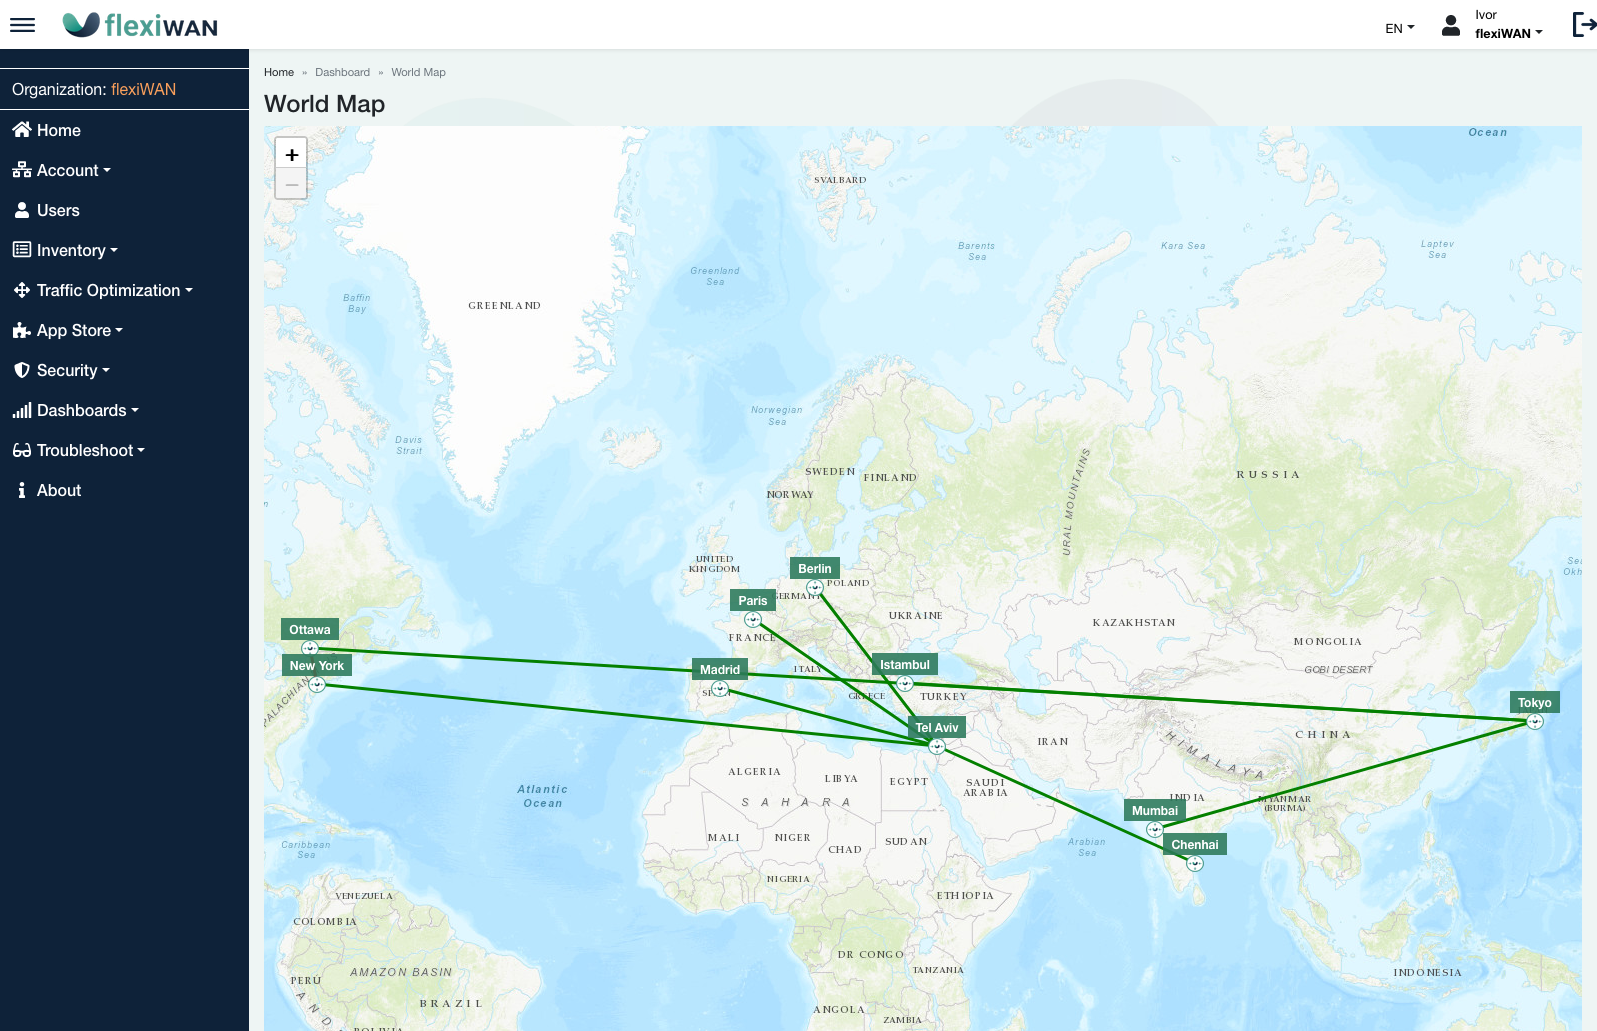
World Map
The World Map dashboard shows an approximate graphical location for each flexiEdge site as well as their connectivity status. Click on each site for more details about it. Note, information is based on IP geolocation and may not be accurate. If location is not correct, flexiEdge site icon can be drag and dropped to a different location.
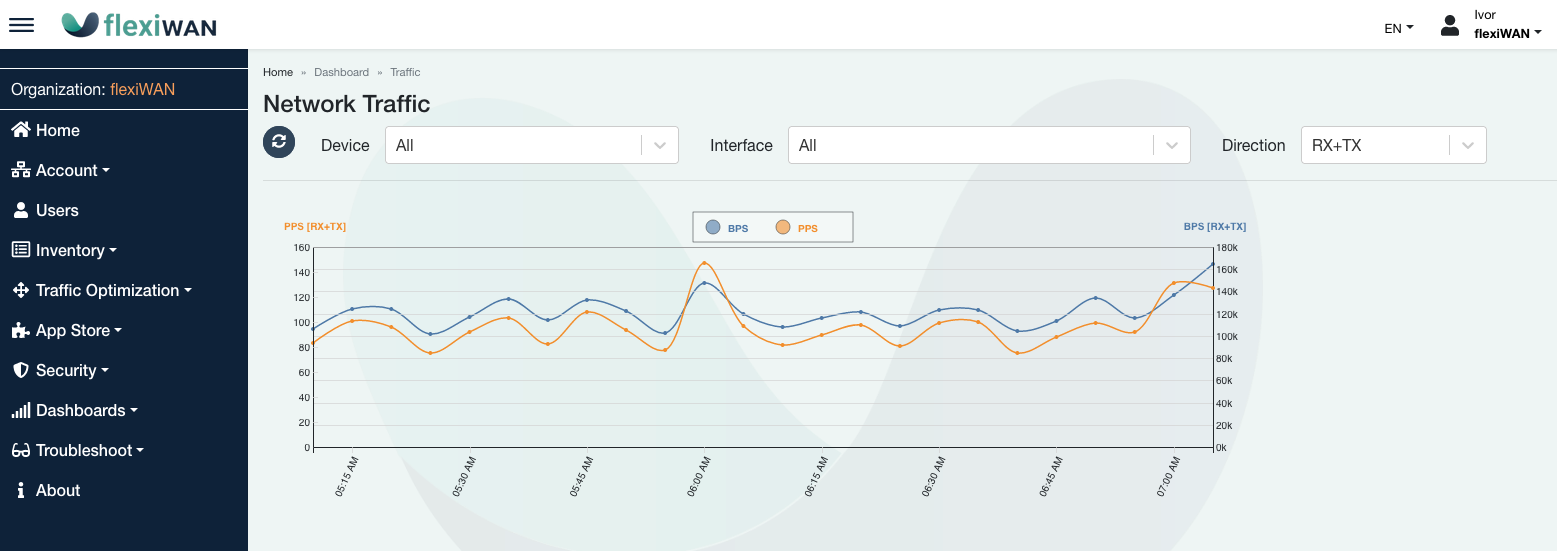
Traffic PPS/BPS
The dashboard -> traffic shows the total Bits Per Second (BPS) and total Packes Per Second (PPS) across the entire network for the last 2 hours every 5 minutes. The left axis show the BPS while the right axis show the PPS. Each line can be enabled or disabled by clicking the icon in the top legend.
Note
Total represents the sum of all the LAN, the Tunnel and the Physical interfaces.