Dashboards
Network Connectivity
The dashboard -> network connectivity shows a graphical representation of the network and tunnels configuration.
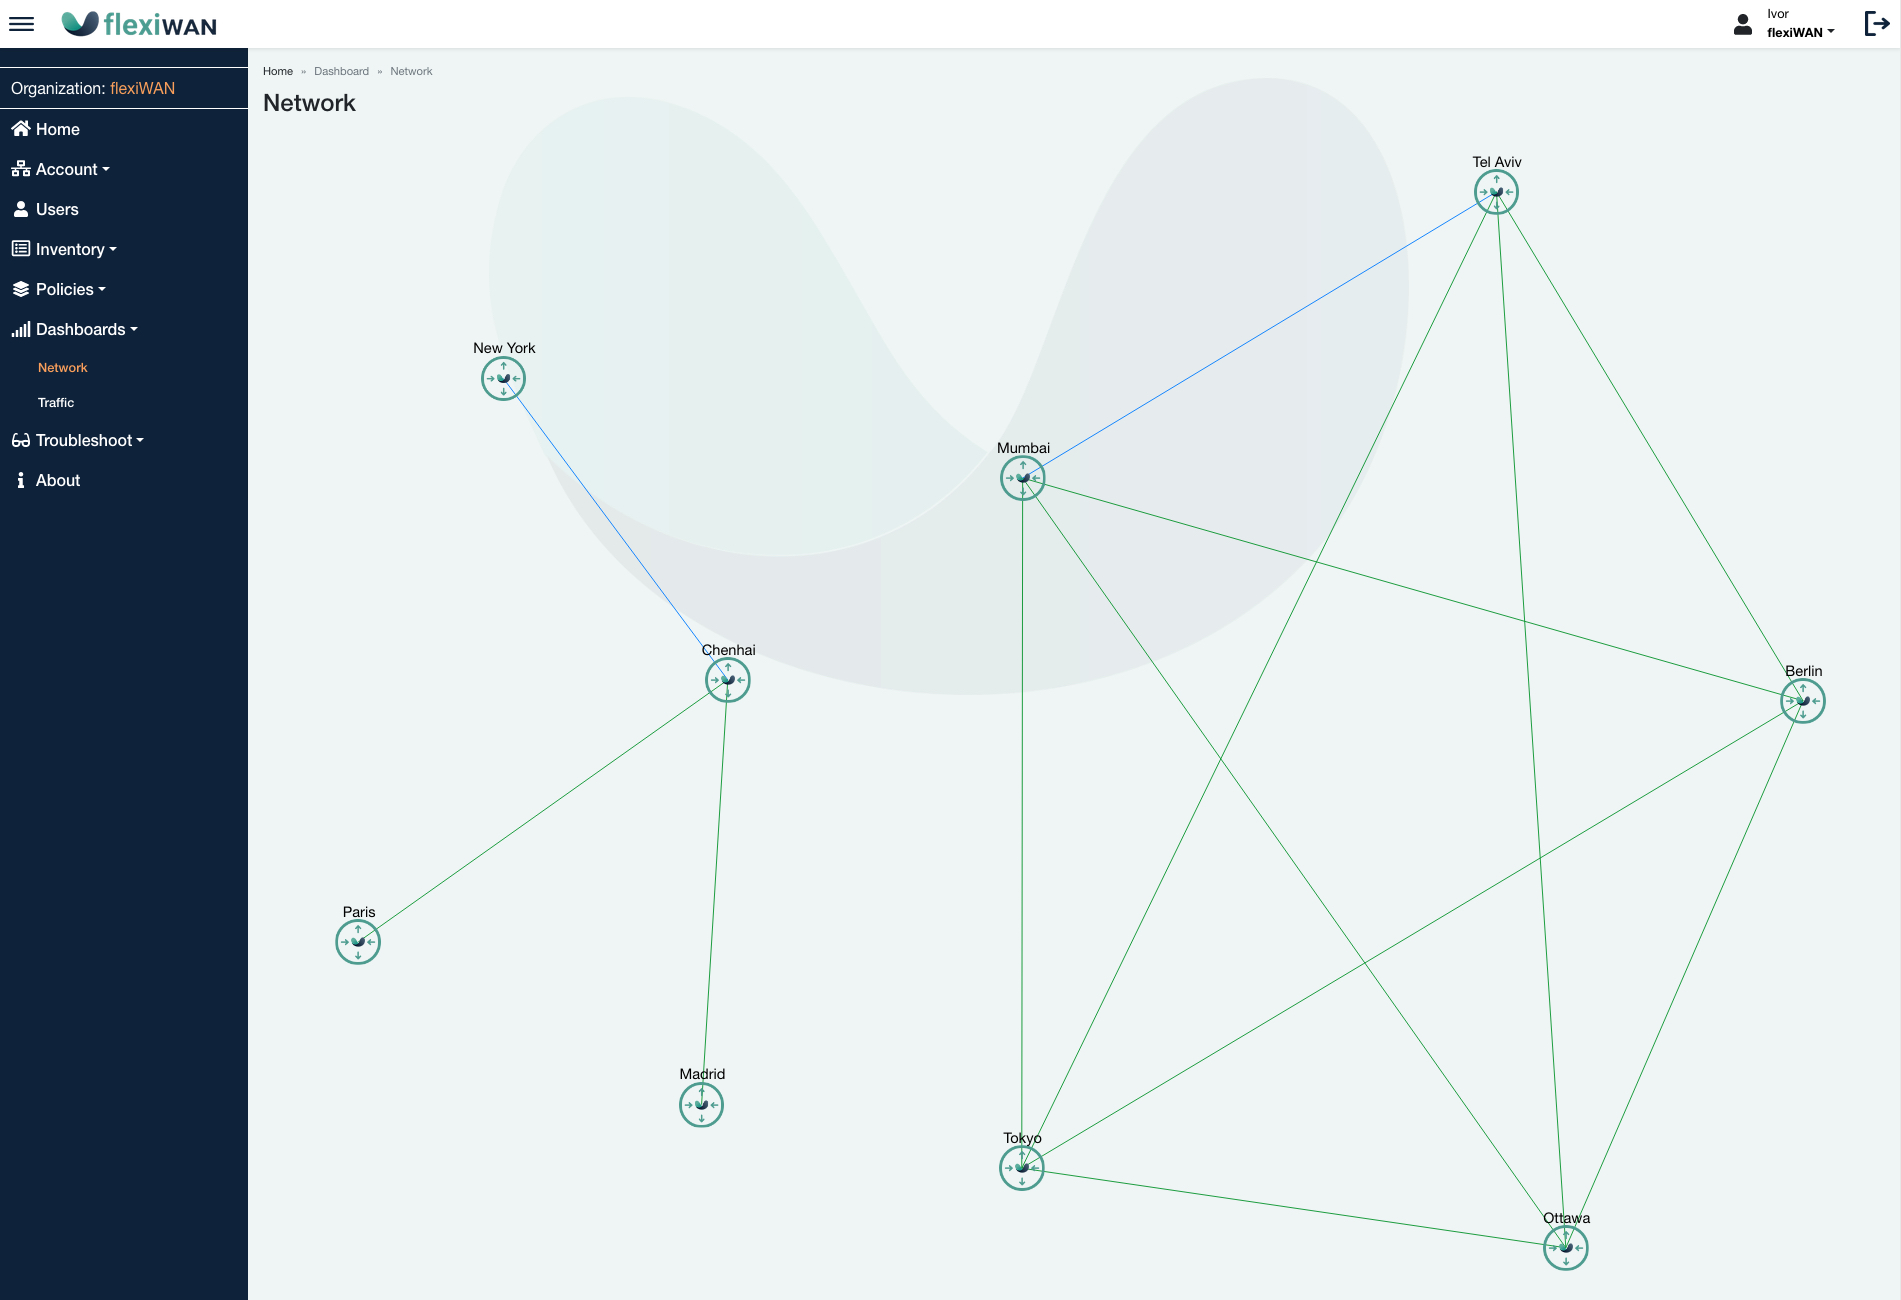
When the tunnel is configured but not connected, the diagram shows a dashed line. You can zoom-in/out by moving the mouse up/down while holding the right-click mouse button.
Traffic PPS/BPS
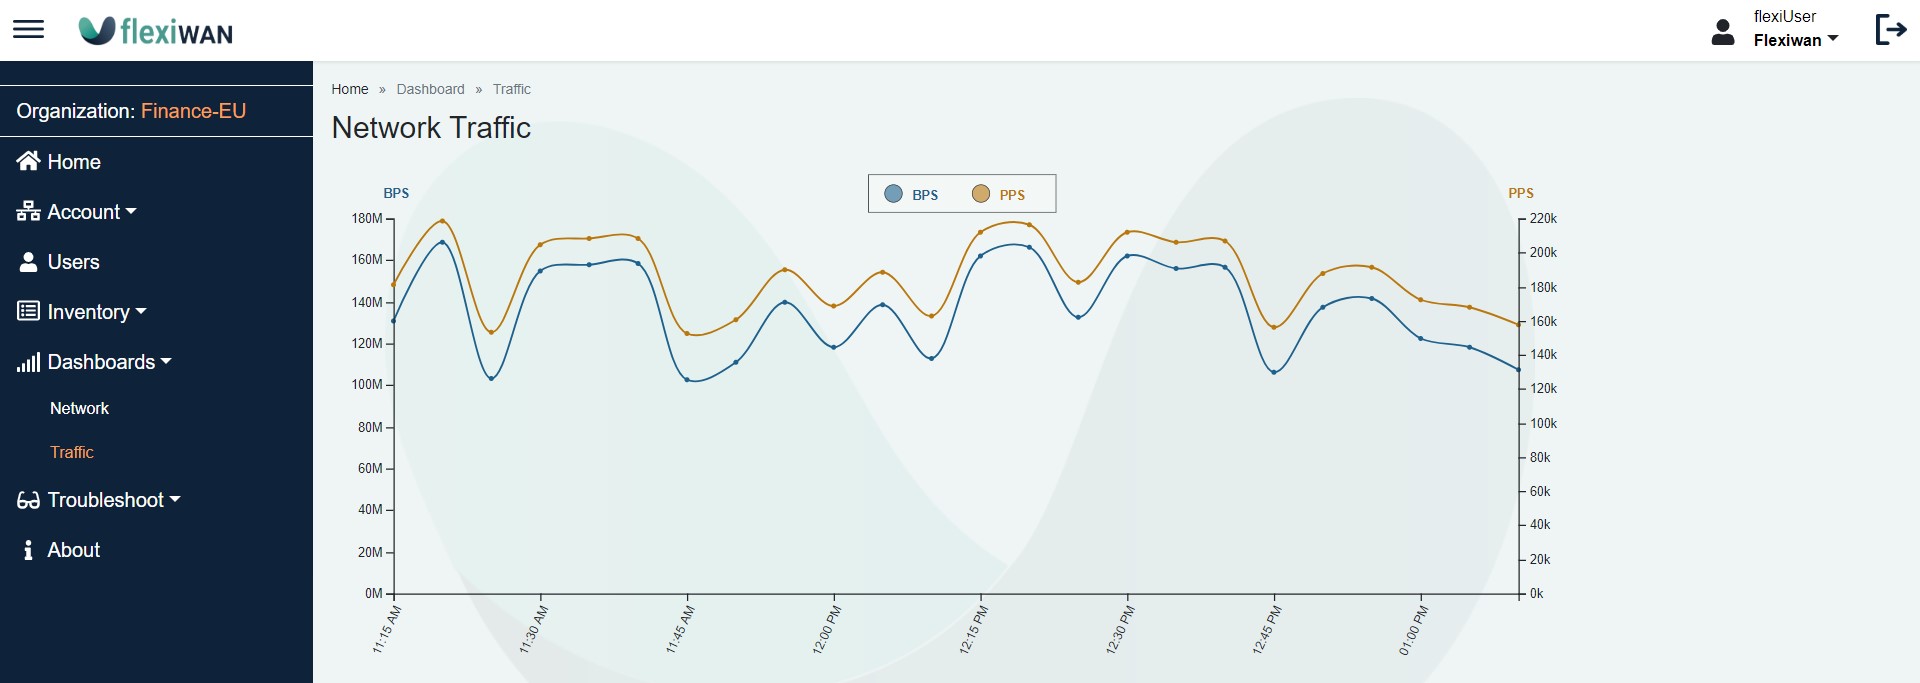
The dashboard -> traffic shows the total Bits Per Second (BPS) and total Packes Per Second (PPS) across the entire network for the last 2 hours every 5 minutes. The left axis show the BPS while the right axis show the PPS. Each line can be enabled or disabled by clicking the icon in the top legend.
Note
Total represents the sum of all the LAN, the Tunnel and the Physical interfaces.